June 10, 2010
SEC puts into place new ‘circuit breaker’ rules to prevent repeat of May 6 stock market plunge
Marcy Gordon, AP Business Writer, On Thursday June 10, 2010, 5:44 pm EDT
WASHINGTON (AP) — Federal regulators on Thursday put in place new rules aimed at preventing a repeat of last month’s harrowing “flash crash” in the stock market.
Members of the Securities and Exchange Commission approved the rules, which call for U.S. stock exchanges to briefly halt trading of some stocks that make big swings.
The major exchanges will start putting the trading breaks into effect as early as Friday for six months. The New York Stock Exchange will begin Friday’s trading session with five stocks: EOG Resources Inc., Genuine Parts Co., Harley Davidson Inc., Ryder System Inc. and Zimmer Holdings Inc. The exchange will gradually add other stocks early next week, expecting to reach by Wednesday the full number that will be covered.
The Nasdaq stock market plans to have the new program fully in place on Monday.
The plan for the “circuit breakers” was worked out by the SEC and the major exchanges following the May 6 market plunge, which saw the Dow Jones industrials lose nearly 1,000 points in less than a half-hour.
Under the new rules, trading of any Standard & Poor’s 500 stock that rises or falls 10 percent or more in a five-minute period will be halted for five minutes. The “circuit breakers” would be applied if the price swing occurs between 9:45 a.m. and 3:35 p.m. Eastern time. That’s almost the entire trading day. But it leaves out the final 25 minutes before the close — a period that often sees raging price swings, especially in recent weeks as the kind of volatility that marked the 2008 financial crisis returned.
The idea is for the trading pause to draw attention to an affected stock, establish a reasonable market price and resume trading “in a fair and orderly fashion,” the SEC said.
On May 6, about 30 stocks listed in the S&P 500 index fell at least 10 percent within five minutes. The drop briefly wiped out $1 trillion in market value as some stocks traded as low as a penny.
The disruption “illustrated a sudden, but temporary, breakdown in the market’s price-setting function when a number of stocks and (exchange-traded funds) were executed at clearly irrational prices,” SEC Chairman Mary Schapiro said in a statement. “By establishing a set of circuit breakers that uniformly pauses trading in a given security across all venues, these new rules will ensure that all markets pause simultaneously and provide time for buyers and sellers to trade at rational prices.”
Read the rest of this entry »
 Leave a Comment » |
  401k, CFTC, circuit breakers, derivatives, efficient-market, equity, Exchange Traded Funds/Notes, financial engineering, FINRA, flash crash, futures, leverage, liquidity, liquidity risk, NYSE, price-setting function, psychology, regulation, risk management, S&P 500, SEC, short ETFs, short-selling, stop-loss, stub quotes | Tagged: comp, eog, gpc, hog, indu, r, spx, zmh |
  Permalink
 Posted by Jason
May 10, 2010
By DONNA KARDOS YESALAVICH And KRISTINA PETERSON
Reuters
Stocks posted their biggest one-day gain in more than a year, boosted by the bailout package to stem Europe’s credit crisis.
The Dow Jones Industrial Average jumped 404.71 points, or 3.9%, to 10785.14, helped by gains in all 30 of its components. The average had its biggest one-day gain in both point and percentage terms since March 23, 2009.
The Standard & Poor’s 500-stock index rose 4.4% to 1159.73, led by its financial and consumer-discretionary sectors, up more than 5% each. All the broad measure’s other indexes posted gains as well.
The jump in U.S. stocks followed rallies in the Asian and European markets after the European Union agreed to a €750 billion ($954.83 billion) bailout, including €440 billion of loans from euro-zone governments., €60 billion from a European Union emergency fund and €250 billion from the International Monetary Fund.
In further coordinated efforts to assuage spooked markets, the European Central Bank will go into the secondary market to buy euro-zone national bonds—a step last week that its president, Jean-Claude Trichet, said the central bank didn’t even contemplate. Meanwhile, the Federal Reserve, working with other central banks, re-activated swap lines so foreign institutions can get access to loans.
“This bailout plan really avoided the worst-case scenario—it avoided contagion and the domino effect,” said Cort Gwon, director of trading strategies of FBN Securities. The package also shifts investors’ attention back to the U.S., where most economic yardsticks have been improving lately, he noted.
The Nasdaq Composite jumped 109.03 points, its first triple-digit point gain since October 2008. It closed at 2374.67, up 4.8%.
Trading volume was higher than the 2010 daily average, though below the frenzied pace of the previous two days, which included an unprecedented “flash crash” and traders’ scramble to square their books after certain trades were canceled. On Monday, composite New York Stock Exchange volume hit 7.1 billion shares, below last week’s peak near 11 billion.
U.S.-listed shares of European banks surged in reaction to the European Union’s bailout plan.
 Leave a Comment » |
  asset rotation, bailout, bankruptcy, bear market, bonds, bridge loans, capital, contagion, corporate bonds, deficits, ECB, economy, Federal Reserve, financial engineering, fiscal policy, flash crash, growth, IMF, inflation, liquidity, liquidity risk, NYSE, Obama, risk management, S&P 500, sentiment, socialized risks, swaps, unfunded liabilities | Tagged: comp, indu, spx |
  Permalink
 Posted by Jason
August 3, 2009
By Sara Lepro and Tim Paradis, AP Business Writers
Monday August 3, 2009, 6:02 pm EDT
NEW YORK (AP) — The Standard & Poor’s 500 index (SPX) is four digits again now that the stock market’s rally has blown into August.
The widely followed stock market measure broke above 1,000 on Monday for the first time in nine months as reports on manufacturing, construction and banking sent investors more signals that the economy is gathering strength. The S&P is used as a benchmark by professional investors, and it’s also the foundation for mutual funds in many individual 401(k) accounts.
Wall Street’s big indexes all rose more than 1 percent, including the Dow Jones industrial average (INDU), which climbed 115 points.
The market extended its summer rally on the type of news that might have seemed unthinkable when stocks cratered to 12-year lows in early March. A trade group predicted U.S. manufacturing activity will grow next month, the government said construction spending rose in June and Ford Motor Co. (F) said its sales rose last month for the first time in nearly two years.
“The market is beginning to smell economic recovery,” said Howard Ward, portfolio manager of GAMCO Growth Fund. “It may be too early to declare victory, but we are well on our way.”
The day’s reports were the latest indications that the recession that began in December 2007 could be retreating. Better corporate earnings reports and economic data propelled the Dow Jones industrial average 725 points in July to its best month in nearly seven years and restarted spring rally that had stalled in June.
On Monday, a report from the Institute for Supply Management, a trade group of purchasing executives, signaled U.S. manufacturing activity should increase next month for the first time since January 2008 as industrial companies restock shelves. Also, the Commerce Department said construction spending rose rather than fell in June as analysts had expected. The reports and rising commodity prices lifted energy and material stocks.
Ford said sales of light vehicles rose 1.6 percent in July. Other major automakers said they saw signs of stability in sales. Investors predicted that the government’s popular cash for clunkers program would boost overall auto sales to their highest level of the year.
Read the rest of this entry »
 Leave a Comment » |
  401k, analysts, asset rotation, bailout, banks, bear market, behavioral science, bonds, buy and hold, capital, China, commodities, copper, crude oil, economy, equity, financials, govt. stats, growth, interest rates, liquidity, mutual fund, real returns, recession, recovery, relative strength, risk management, S&P 500, sentiment, small caps, Treasury bonds, unemployment | Tagged: bcs, cat, comp, f, hsbc, indu, intc, rut, spx, usd |
  Permalink
 Posted by Jason
June 16, 2009
The S&P 500 celebrated its great technical accomplishment highlighted in our last note by doing exactly nothing. Maintaining a tight 32 point range from top to bottom, the S&P 500 netted just over 3 points from our previous note to the closing price last Friday, June 12. This week has changed the tune, giving up more than 34 points in just two days. Surrendering initial support in the 925-930 area designated by the May highs, the SPX is once again bearing down on the 200 day moving average, this time from above. Additional support of the 50 day moving average is also moving into the area, just 15.5 points below the 200 day as of today, and rising. The lows from May, which are also the highs from April and February, mark another major support level in the 875-880 range.

Both the MACD and the daily 13/34 exponential moving average indicator have signaled a negative divergence by not confirming the new highs in the price of the average. With the January highs holding as resistance, the head and shoulders bottom we discussed in Still overbought, but over first resistance also is still in play. As we noted, “…finishing the inverse head and shoulders bottom should happen somewhere around the end of June time wise to produce a symmetrical pattern. At this point, it looks like the January highs need to hold as resistance to keep the inverse head and shoulders pattern in play. This is also the approximate level of the 200 day moving average currently and the 200 day stopped the SPX multiple times from 2001-2002, plus twice early in 2003. The first test early in 2003 led to the formation of the right shoulder in the bottoming pattern and the second test required a test of the 50 day moving average as support before breaking out and leaving the 200 day well behind.” With the 50 and 200 day moving averages relatively close together this time, plus the support of the recent lows/previous highs around 875-880, this market has plenty of candidates for a right shoulder not far from current prices. A convincing move back below 875 would signal a deeper correction with targets as low as 741 still completely valid.

Which brings us to the market leading NASDAQ Composite. Since our last note highlighting the breakout by the COMP, a brief rally has fizzled out with the last two trading days completely erasing the gains and setting up a quick test of the breakout point as support. The rally stopped short of filling the gap opened on the way down in early October 2008, but did manage to bring the 50 and 200 day moving averages into a bullish golden cross. Plenty of support exists for this market, but it doesn’t come into play until 60-120 points below the breakout point at 1785 if the breakout fails to hold. Targets as low as 1500 do not invalidate the uptrend if the SPX makes a run toward the 2002 lows or even 741. The MACD is also showing a negative divergence here by not confirming the new high in price and the ROC shows a failure to build momentum on the breakout.

We are again returning to our short positions, including SH, after precautionary stop outs proved unnecessary and untimely. Our position in SH specifically was re-entered exactly at the stop out price (see Security Growth for details).
 Leave a Comment » |
  200 day MA, 50 day MA, asset rotation, bear market, charts, Exchange Traded Funds/Notes, growth, real returns, relative strength, risk management, S&P 500, sentiment, short ETFs, short-selling, tech stocks | Tagged: comp, sh, spx |
  Permalink
 Posted by Jason
June 1, 2009
The NASDAQ leads the market higher; leaves the 200 day behind
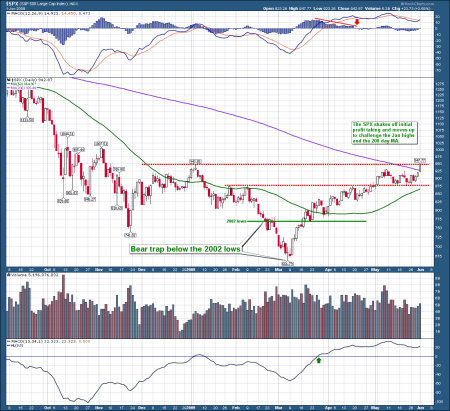
The S&P 500 accomplished something today, trading above the 200 day simple moving average for the first time in over a year. It was last call in May of 2008 at the 200 day for the SPX before dropping over 50% to the lows of this past March (the SPX hasn’t actually closed above this trend line since late 2007). Today also marks a new high for 2009, some 42% above those March lows in less than three months! Year-to-date the SPX has gained just over 4%.
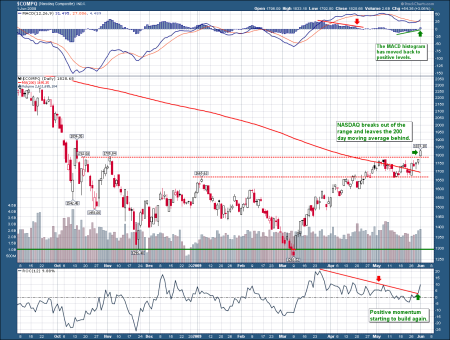
The NASDAQ is the real star leading the markets higher and breaking free from the recent consolidation range. The NASDAQ is also some 8% above its 200 day simple moving average and almost 10% above the early January highs. Sitting on a year-to-date gain of 16% and almost 45% above the March lows, large cap techs are showing investors’ renewed interest in risk.
At this point, we are exiting the position in SH with a small loss on this renewed strength (see Security Growth for details).
 Leave a Comment » |
  200 day MA, asset rotation, bear market, capital, charts, growth, real returns, recession, relative strength, S&P 500, tech stocks | Tagged: comp, sh, spx |
  Permalink
 Posted by Jason
May 5, 2009
Another update finds the market shaking off initial profit taking to challenge the highs for the year. Monday’s big push finally left the late January, early February highs behind for the S&P 500 (SPX) after about two weeks of backing and filling to make room for the exit of early profit takers. Volume for this stage of the rally has not been impressive, declining since the large profit taking day in the third week of April. What is impressive, is new buyers have stepped up to continue to push prices higher. Fear of “missing the bottom” is setting in and chasing the rally at this point remains dangerous.

The NASDAQ has been leading the charge, already surpassing the highs for the year to challenge the early November 2008 highs and the 200 day simple moving average. Up more than 39% in less than two months is a remarkable move and building on that through the seasonally weak summer session is going to be difficult. Up days are beating down days by more than 2 to 1 since the bottom, but the pace of gains is decelerating. Volume has remained relatively solid and this change in market leadership posture is notable. Investors have clearly decided to favor more aggressive stocks in this recovery, with the small and mid caps also showing relative strength.

It’s time to break out a chart we were saving for later, as the comparison may be valid already. This is a chart of the bottom formed in the SPX during 2002-2003, after the tech bust. While the bottom itself formed an inverse head and shoulders pattern (which we expect this time also), the recovery from the right shoulder is what really interests us here. Since the drop was not as violent and much more time was worked off with the head and shoulders bottom, the moving averages were not as far above the low prices and were overtaken sooner as a result. But look at the trend that steadily moved up from March to June, before flattening out for the summer, then racing higher again into 2004. It was less than a 30% gain for the first leg up in 2003 from the March low; it’s already 36% for the SPX from the bottom in March this year. While the low was much lower this time, the highs and resistance levels from both years are almost identical. In 2003, the SPX overtook the early January highs around 930 in early May. After a quick, steep drop below 920 to test the breakout, it was off to the races for another straight month, rising over 10% before the June highs. Then it was one test of the inverse head and shoulders neckline in early August at 960 before moving over 1150 by early 2004. This year, the early January highs are in the area of 944 and the SPX is again challenging them in early May. A breakout here followed by a retest of the 920 level could again produce a similar result. The only problem is finishing the inverse head and shoulders bottom, which should happen somewhere around the end of June time wise to produce a symmetrical pattern. At this point, it looks like the January highs need to hold as resistance to keep the inverse head and shoulders pattern in play. This is also the approximate level of the 200 day moving average currently and the 200 day stopped the SPX multiple times from 2001-2002, plus twice early in 2003. The first test early in 2003 led to the formation of the right shoulder in the bottoming pattern and the second test required a test of the 50 day moving average as support before breaking out and leaving the 200 day well behind. Either of those would be a welcomed event for this market to burn off some overbought conditions and excess euphoria. With the VIX at the lowest levels in seven months, purchasing some protection via puts is probably a good idea. We continue to hold and look to add to our position in the ProShares Short S&P 500 ETF (SH) which is about 5% under water now from our first entry. Select longs continue to beat the market averages by a wide margin.

 Leave a Comment » |
  200 day MA, 50 day MA, asset rotation, bear market, bubbles, buy and hold, charts, contrarian, equity, Exchange Traded Funds/Notes, growth, mid caps, real returns, relative strength, risk management, S&P 500, sentiment, short ETFs, short-selling, small caps | Tagged: comp, rmc, rut, sh, spx |
  Permalink
 Posted by Jason
April 14, 2009
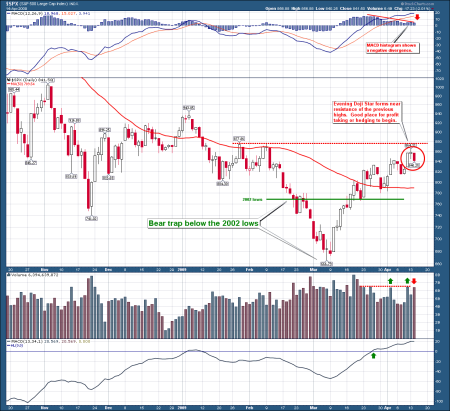
An update on the SPX chart today to show the market finding resistance near previous highs. We are adding a new indicator to the top of the chart, the MACD. The negative divergence in the MACD histogram reinforces the strength of this resistance as the market advance begins to stall. Finally, we have a short term reversal pattern showing in the candlesticks as an Evening Doji Star has formed over the last 3 trading days. Taken together, it looks as if profit taking may have already started.
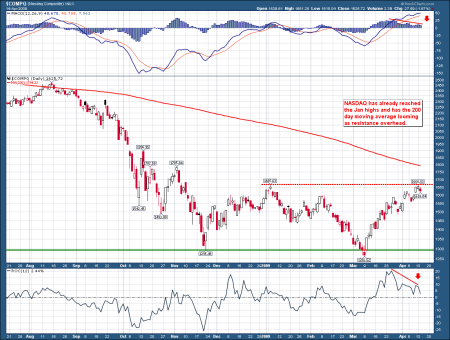
The NASDAQ chart shows similar resistance being met at the Jan highs with negative divergences in the MACD histogram and the Rate of Change indicator which is approaching the zero line. Both of these confirm the loss of momentum as the market approaches resistance.
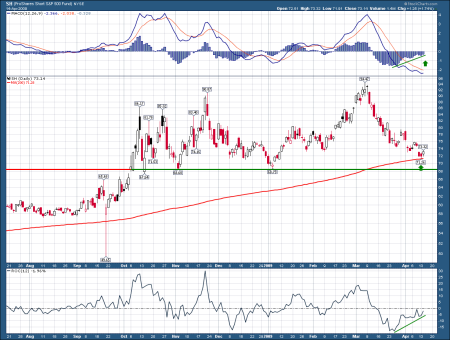
Exactly the opposite looks to be developing in the ProShares Short S&P 500 Fund ETF (SH) as positive divergences are present with the price firming near support. Hedging long exposure here and/or taking profits looks like a good idea. It’s still a bear market rally at this point.
 Leave a Comment » |
  200 day MA, 50 day MA, asset rotation, bear market, buy and hold, capital, cash out, charts, contrarian, equity, Exchange Traded Funds/Notes, growth, real returns, relative strength, risk management, S&P 500, short ETFs | Tagged: comp, sh, spx |
  Permalink
 Posted by Jason
December 16, 2008
Aggressive action by the Federal Reserve today pushed most markets above their respective simple 50 day moving averages for the first time since September. We have highlighted the 50 day as resistance level number one in prior notes and have shown it to be critical resistance along with the 200 day and 80 week. This is a primary step to recovery and opens the door to a potential challenge of the 200 day near the beginning of 2009.
A rally to the 200 day would be quite significant as the recent violent plunge has opened up a large gap over the 50 day. A similar test of the 200 day as resistance came in early 2002, though the gap was not as dramatic, because the market did not fall to such lows as quickly as this year.
See the charts for the major averages below, with the 50 day moving average in blue and the 200 day in red:


 Leave a Comment » |
  200 day MA, 50 day MA, 80 week MA, asset rotation, bear market, buy and hold, charts, equity, Federal Reserve, relative strength, S&P 500, sentiment | Tagged: comp, indu, nya, spx |
  Permalink
 Posted by Jason
October 6, 2008
Monday October 6, 8:26 pm ET
By Joe Bel Bruno and Tim Paradis, AP Business Writers
Despite big afternoon rally, Wall Street finishes below 10,000 for first time since 2004
NEW YORK (AP) — Wall Street joined in a worldwide cascade of despair Monday over the financial crisis, driving the Dow Jones industrials to their biggest loss ever during a trading day. Even a big afternoon rally failed to keep the Dow from its first close below 10,000 since 2004.
The sell-off came despite the $700 billion U.S. government bailout package, which was signed into law Friday after two weeks in which traders had appeared to count on the rescue as their only hope to avoid a market meltdown.
At its worst point, the Dow was down more than 800 points, an intraday record. The stock market rallied during the final 90 minutes of the trading day, and the Dow finished down about 370 points at 9,955.50.
The average is down almost 30 percent from its all-time high of 14,164.53, set a year ago Thursday.
Speculation among traders late in the session that the market’s pullback had been severe enough to force the Federal Reserve into taking other steps to soothe the markets helped stocks rebound from their lows.
“If you can’t say that we’re oversold now I don’t know what you say. You’re at least due for a bounce if nothing else,” said Bill Stone, chief investment strategist for PNC Wealth Management.
The global plunge in stocks was under way well before Wall Street ever woke up. In Japan, the Nikkei average lost more than 4 percent. And then the losses spread across Europe — nearly 6 percent for the FTSE-100 in Britain, 7 percent for the German DAX and more than 9 percent for France’s CAC-40.
Read the rest of this entry »
 Leave a Comment » |
  401k, asset rotation, bailout, bank failure, bankruptcy, banks, bear market, bonds, bridge loans, bubbles, capital, commercial paper, debt-ceiling, deficits, derivatives, economy, election, equity, federal budget, Federal Reserve, financials, govt. stats, housing, income tax, interest rates, lending standards, MBS, mortgages, president, recession, regulation, risk management, S&P 500, SEC, securitization, sentiment, subprime, unemployment, unfunded liabilities, writedowns | Tagged: comp, indu, rut, spx, wlsh |
  Permalink
 Posted by Jason
July 18, 2008
Well, our president may not have a magic wand, but it looks like our Fed Chairman does.
This weekend Big Ben got together with his govt. cronies and they whipped up a wicked brew that is the antidote to the housing crisis and savior of all things financial. The SEC put the clamps on the shorts, the Treasury got into the mortgage underwriting business and Big Ben opened the Fed money faucet a little wider.
Hooray!??
Let’s see, that’s $30B for Bear Stearns, $8B for Indy Mac & now $5T worth of mortgages at Fannie and Freddie. I wonder if the cost of printing dollars has gone up with the increased raw material costs?
Our LD President Bush danced on the scene with an empty promise to drill the OCS for a few hundred thousand Bpd in 10 years and the world was right again.
Oil plunged, bank stocks soared. It must have brought a smile to their faces.
But is it reality? Have the finance gods truly been appeased?
Read the rest of this entry »
 Leave a Comment » |
  80 week MA, asset rotation, bailout, bank failure, banks, bear market, charts, commodities, crude oil, equity, Federal Reserve, financials, fiscal policy, S&P 500, SEC, sentiment | Tagged: bsc, comp, cpc, fnm, fre, imb, indu, rut, spx, vix, wlsh |
  Permalink
 Posted by Jason


 Posted by Jason


