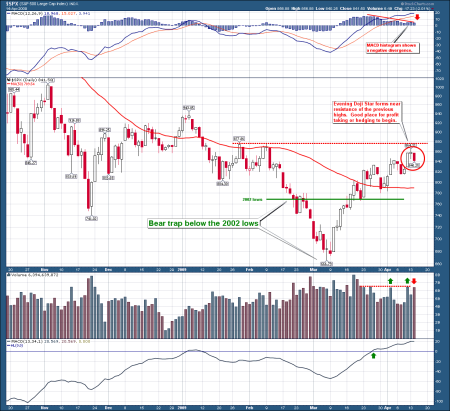
An update on the SPX chart today to show the market finding resistance near previous highs. We are adding a new indicator to the top of the chart, the MACD. The negative divergence in the MACD histogram reinforces the strength of this resistance as the market advance begins to stall. Finally, we have a short term reversal pattern showing in the candlesticks as an Evening Doji Star has formed over the last 3 trading days. Taken together, it looks as if profit taking may have already started.
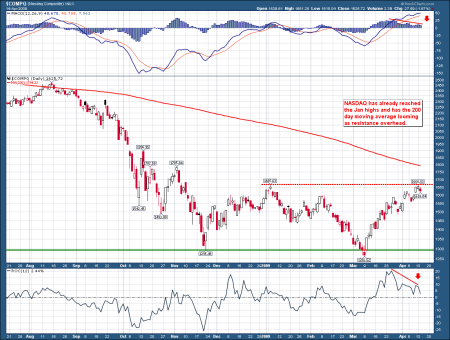
The NASDAQ chart shows similar resistance being met at the Jan highs with negative divergences in the MACD histogram and the Rate of Change indicator which is approaching the zero line. Both of these confirm the loss of momentum as the market approaches resistance.
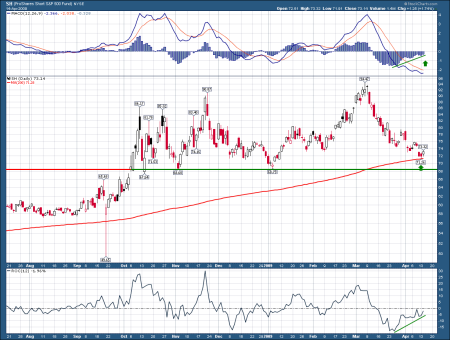
Exactly the opposite looks to be developing in the ProShares Short S&P 500 Fund ETF (SH) as positive divergences are present with the price firming near support. Hedging long exposure here and/or taking profits looks like a good idea. It’s still a bear market rally at this point.


