June 16, 2009
The S&P 500 celebrated its great technical accomplishment highlighted in our last note by doing exactly nothing. Maintaining a tight 32 point range from top to bottom, the S&P 500 netted just over 3 points from our previous note to the closing price last Friday, June 12. This week has changed the tune, giving up more than 34 points in just two days. Surrendering initial support in the 925-930 area designated by the May highs, the SPX is once again bearing down on the 200 day moving average, this time from above. Additional support of the 50 day moving average is also moving into the area, just 15.5 points below the 200 day as of today, and rising. The lows from May, which are also the highs from April and February, mark another major support level in the 875-880 range.

Both the MACD and the daily 13/34 exponential moving average indicator have signaled a negative divergence by not confirming the new highs in the price of the average. With the January highs holding as resistance, the head and shoulders bottom we discussed in Still overbought, but over first resistance also is still in play. As we noted, “…finishing the inverse head and shoulders bottom should happen somewhere around the end of June time wise to produce a symmetrical pattern. At this point, it looks like the January highs need to hold as resistance to keep the inverse head and shoulders pattern in play. This is also the approximate level of the 200 day moving average currently and the 200 day stopped the SPX multiple times from 2001-2002, plus twice early in 2003. The first test early in 2003 led to the formation of the right shoulder in the bottoming pattern and the second test required a test of the 50 day moving average as support before breaking out and leaving the 200 day well behind.” With the 50 and 200 day moving averages relatively close together this time, plus the support of the recent lows/previous highs around 875-880, this market has plenty of candidates for a right shoulder not far from current prices. A convincing move back below 875 would signal a deeper correction with targets as low as 741 still completely valid.

Which brings us to the market leading NASDAQ Composite. Since our last note highlighting the breakout by the COMP, a brief rally has fizzled out with the last two trading days completely erasing the gains and setting up a quick test of the breakout point as support. The rally stopped short of filling the gap opened on the way down in early October 2008, but did manage to bring the 50 and 200 day moving averages into a bullish golden cross. Plenty of support exists for this market, but it doesn’t come into play until 60-120 points below the breakout point at 1785 if the breakout fails to hold. Targets as low as 1500 do not invalidate the uptrend if the SPX makes a run toward the 2002 lows or even 741. The MACD is also showing a negative divergence here by not confirming the new high in price and the ROC shows a failure to build momentum on the breakout.

We are again returning to our short positions, including SH, after precautionary stop outs proved unnecessary and untimely. Our position in SH specifically was re-entered exactly at the stop out price (see Security Growth for details).
 Leave a Comment » |
  200 day MA, 50 day MA, asset rotation, bear market, charts, Exchange Traded Funds/Notes, growth, real returns, relative strength, risk management, S&P 500, sentiment, short ETFs, short-selling, tech stocks | Tagged: comp, sh, spx |
  Permalink
 Posted by Jason
June 1, 2009
The NASDAQ leads the market higher; leaves the 200 day behind
The S&P 500 accomplished something today, trading above the 200 day simple moving average for the first time in over a year. It was last call in May of 2008 at the 200 day for the SPX before dropping over 50% to the lows of this past March (the SPX hasn’t actually closed above this trend line since late 2007). Today also marks a new high for 2009, some 42% above those March lows in less than three months! Year-to-date the SPX has gained just over 4%.
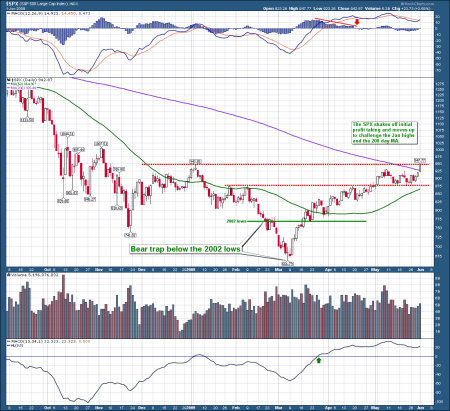
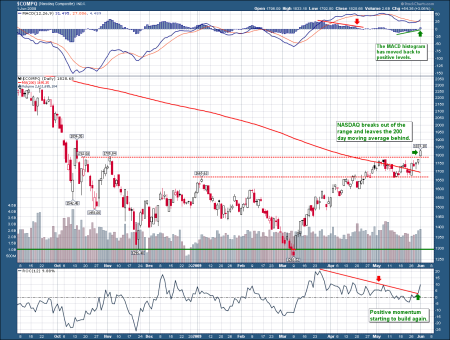
The NASDAQ is the real star leading the markets higher and breaking free from the recent consolidation range. The NASDAQ is also some 8% above its 200 day simple moving average and almost 10% above the early January highs. Sitting on a year-to-date gain of 16% and almost 45% above the March lows, large cap techs are showing investors’ renewed interest in risk.
At this point, we are exiting the position in SH with a small loss on this renewed strength (see Security Growth for details).
 Leave a Comment » |
  200 day MA, asset rotation, bear market, capital, charts, growth, real returns, recession, relative strength, S&P 500, tech stocks | Tagged: comp, sh, spx |
  Permalink
 Posted by Jason
May 5, 2009
Another update finds the market shaking off initial profit taking to challenge the highs for the year. Monday’s big push finally left the late January, early February highs behind for the S&P 500 (SPX) after about two weeks of backing and filling to make room for the exit of early profit takers. Volume for this stage of the rally has not been impressive, declining since the large profit taking day in the third week of April. What is impressive, is new buyers have stepped up to continue to push prices higher. Fear of “missing the bottom” is setting in and chasing the rally at this point remains dangerous.

The NASDAQ has been leading the charge, already surpassing the highs for the year to challenge the early November 2008 highs and the 200 day simple moving average. Up more than 39% in less than two months is a remarkable move and building on that through the seasonally weak summer session is going to be difficult. Up days are beating down days by more than 2 to 1 since the bottom, but the pace of gains is decelerating. Volume has remained relatively solid and this change in market leadership posture is notable. Investors have clearly decided to favor more aggressive stocks in this recovery, with the small and mid caps also showing relative strength.

It’s time to break out a chart we were saving for later, as the comparison may be valid already. This is a chart of the bottom formed in the SPX during 2002-2003, after the tech bust. While the bottom itself formed an inverse head and shoulders pattern (which we expect this time also), the recovery from the right shoulder is what really interests us here. Since the drop was not as violent and much more time was worked off with the head and shoulders bottom, the moving averages were not as far above the low prices and were overtaken sooner as a result. But look at the trend that steadily moved up from March to June, before flattening out for the summer, then racing higher again into 2004. It was less than a 30% gain for the first leg up in 2003 from the March low; it’s already 36% for the SPX from the bottom in March this year. While the low was much lower this time, the highs and resistance levels from both years are almost identical. In 2003, the SPX overtook the early January highs around 930 in early May. After a quick, steep drop below 920 to test the breakout, it was off to the races for another straight month, rising over 10% before the June highs. Then it was one test of the inverse head and shoulders neckline in early August at 960 before moving over 1150 by early 2004. This year, the early January highs are in the area of 944 and the SPX is again challenging them in early May. A breakout here followed by a retest of the 920 level could again produce a similar result. The only problem is finishing the inverse head and shoulders bottom, which should happen somewhere around the end of June time wise to produce a symmetrical pattern. At this point, it looks like the January highs need to hold as resistance to keep the inverse head and shoulders pattern in play. This is also the approximate level of the 200 day moving average currently and the 200 day stopped the SPX multiple times from 2001-2002, plus twice early in 2003. The first test early in 2003 led to the formation of the right shoulder in the bottoming pattern and the second test required a test of the 50 day moving average as support before breaking out and leaving the 200 day well behind. Either of those would be a welcomed event for this market to burn off some overbought conditions and excess euphoria. With the VIX at the lowest levels in seven months, purchasing some protection via puts is probably a good idea. We continue to hold and look to add to our position in the ProShares Short S&P 500 ETF (SH) which is about 5% under water now from our first entry. Select longs continue to beat the market averages by a wide margin.

 Leave a Comment » |
  200 day MA, 50 day MA, asset rotation, bear market, bubbles, buy and hold, charts, contrarian, equity, Exchange Traded Funds/Notes, growth, mid caps, real returns, relative strength, risk management, S&P 500, sentiment, short ETFs, short-selling, small caps | Tagged: comp, rmc, rut, sh, spx |
  Permalink
 Posted by Jason
April 14, 2009
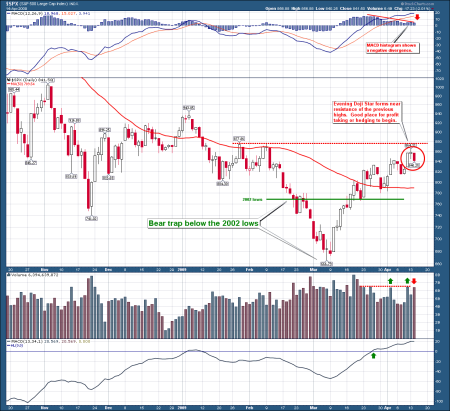
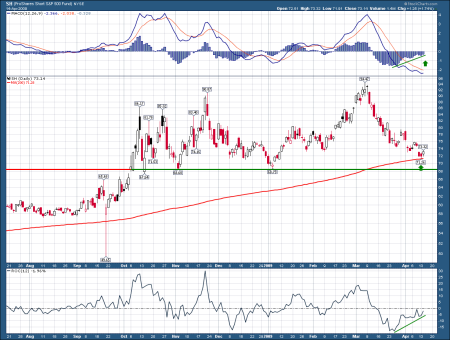
An update on the SPX chart today to show the market finding resistance near previous highs. We are adding a new indicator to the top of the chart, the MACD. The negative divergence in the MACD histogram reinforces the strength of this resistance as the market advance begins to stall. Finally, we have a short term reversal pattern showing in the candlesticks as an Evening Doji Star has formed over the last 3 trading days. Taken together, it looks as if profit taking may have already started.
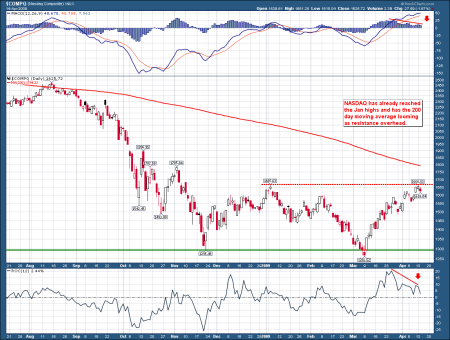
The NASDAQ chart shows similar resistance being met at the Jan highs with negative divergences in the MACD histogram and the Rate of Change indicator which is approaching the zero line. Both of these confirm the loss of momentum as the market approaches resistance.
Exactly the opposite looks to be developing in the ProShares Short S&P 500 Fund ETF (SH) as positive divergences are present with the price firming near support. Hedging long exposure here and/or taking profits looks like a good idea. It’s still a bear market rally at this point.
 Leave a Comment » |
  200 day MA, 50 day MA, asset rotation, bear market, buy and hold, capital, cash out, charts, contrarian, equity, Exchange Traded Funds/Notes, growth, real returns, relative strength, risk management, S&P 500, short ETFs | Tagged: comp, sh, spx |
  Permalink
 Posted by Jason
September 5, 2008
These are about the only things we could find trading up over the last few days.
Many look primed for more gains as we enter the weakest month of the year with many sectors looking to have failed at key resistance.

 Leave a Comment » |
  banks, bear market, financials, healthcare, relative strength, risk management, S&P 500, short ETFs, small caps | Tagged: dog, dug, dxd, eev, efu, efz, eum, ewv, fxp, myy, mzz, psq, qid, rew, rwm, rxd, sbb, scc, sdd, sdk, sdp, sds, sfk, sh, sij, sjf, sjh, sjl, skf, skk, smn, srs, ssg, szk, twm |
  Permalink
 Posted by Jason


 Posted by Jason


